


Chrome and image filters
How I faced incorrect assumptions of a working solution
10 October 2023
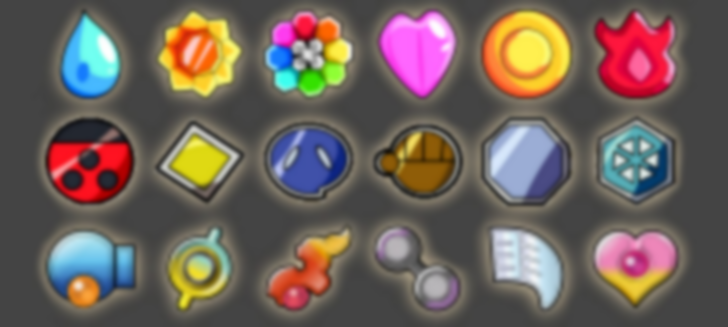
Last year I wrote a HTML canvas application to help players track their progress in randomized versions of Pokémon. Back then, I ran into performance issues and rewrote most of my rendering code without fully understanding the issue. Today, I went back to it to test if my assumptions were right.
The issue was only replicable in Google Chrome with hardware acceleration turned off. I thought rendering many images would slow down the rendering, no matter how small or big these images were. I had come to this conclusion by deactivating the rendering of certain parts of my application, but I didn't do any further testing back then.
So, after I quickly put together some code to reproduce the bug, I realized that my assumptions were wrong:
Debugging this has been a fun experience. I did solve the issue back then, I just didn't know how. Fortunately, I tend to write easy-to-find commits for important stuff, so I could find the one with the big rendering rewrite and check the code before and after the update. The code before the big update looked something like this:
function Render() {
    if (rerender_all) {
        RenderMarks(secondary_canvas); // Renders all the icons to a second buffer
    }
    RenderEverythingElse(canvas);
    canvas.context.drawImage(secondary_canvas);
}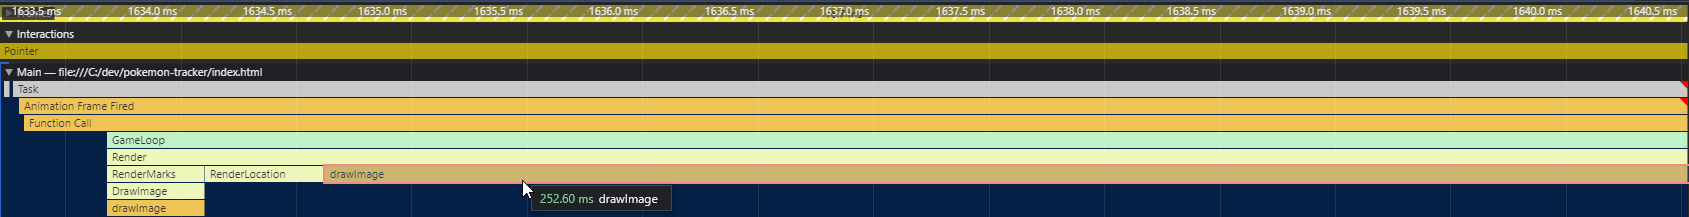
Unfortunately, Chrome dev tools didn't give much info about what it's slowing down this code. If we check we can see that it spends most of its time executing the last line, but how long it takes to render the line is affected by the state of the rerender_all boolean.
Both of the called functions also call drawImage multiple times, but only the last one takes all the time. My guess is that drawImage doesn't actually draw but instead queues the draw call. The last one might not be able to do queue it because the secondary_canvas isn't ready to be drawn.
So this time around, I dive into the RenderMarks() function to see if I can pinpoint what exactly is causing the issue. Here's the simplified code:
function RenderMarks() {
    let unfiltered_marks = []; // Icons rendered as is
    let filtered_marks = [];   // Icons rendered with filters
    let boxes = [];            // Squares drawn if count is > 0

    // ----- Obtain marks -----
    for (let m of game.marks) {
        unfiltered_marks.push(m);
        if (count && count > 0) boxes.push(m);
    }

    // ----- Obtain progress tracker -----
    for (let m of game.progress) {
        if (game.obtained.has(m)) unfiltered_marks.push(m);
        else                      filtered_marks.push(m);
        if (count && count > 0) boxes.push(m);
    }

    // ----- Render background progress tracker -----
    DrawBackground(); // Draws a single white square as a background

    // ----- Render everything in bulk -----
    context.save(); {
        context.lineWidth   = 1;
        context.strokeStyle = "#AAAAAA";
        for (let b of boxes) {
            context.strokeRect(b.x, b.y, b.w, b.h);
        }

        for (let m of unfiltered_marks) {
            context.drawImage(m.image, m.x, m.y, m.w, m.h);
        }

        context.filter = "grayscale(100%) opacity(50%)";
        for (let m of filtered_marks) {
            context.drawImage(m.image, m.x, m.y, m.w, m.h);
        }
    } context.restore();
}
This code was written before the big update and you can see another attempt at solving a problem I didn't quite understand. Instead of drawing each image directly, I gathered all the positions and states before issuing the drawing calls hoping that drawing everything in bulk will make things faster. Needless to say, it didn't work.
But this structure helps me discover the actual issue. Removing the context.filter line removes the performance issue. Knowing this, I update my attempt at reproducing the bug.
The solution I ended up implementing isn't an incorrect one, but if I had properly tested it back then I could've implemented quicker solutions which the community needed.
After obtaining the images I could've stored an additional filtered version of each image at the start so the app wouldn't stutter while using it or I could've used composite operations which don't seem to have this performance issues.
I uploaded here the bug reproduction with different amounts of sprites and filters so anyone can test them with different browsers and settings. Not all filters equally affect performance the same way.
Even though my application no longer has this issue, understanding it is the first step towards building better programs in the future. This tracker has been my first project to gain interest, so it's a great opportunity to not dismiss these learning opportunities and check my assumptions.